Many school improvement plans include measurements based on surveys of pupils, staff or parents, but do you need a response from every person to be confident in your results. Would the views of just 50% of your parents be a suitable sample?
Well, as with a lot of statistics it depends on what action you want to take on the back of the results. In general, the bigger the stating group (e.g. number of pupils), the smaller percentage of responses you will need to your surveys.
The other major factor is how accurate you need the results to be. For example, if you ask parents how happy they are with the communication they receive from the school – would you take different action if 90% said they were happy vs. 91.27%?
With surveys that don’t have 100% response rate, you need to understand how the response rate will impact on how confident you can be in the result.
| Type | How confident can you be in the result? | Pros | Cons | Example |
| Low response rate | Fairly confident | Cheap and quick | Gives an approx. answer | ~90% |
| High response rate | Very confident | Reasonably robust figure | More time involved | 91% (+/-3%) |
| 100% response (Census) | 100% confident | Every view is collected and can be analysed | Can be time consuming | 92.64% |
As with all analysis, when handling survey data I refer to my principles of data best practice.

What is your margin of error?
Unless you have 100% response rate, the results of your survey will have an “error margin”. Being aware of the range of the answers is very important when you are comparing surveys over time.
The graph below shows the % of people saying they were happy (in the blue dotted line) and the results of a survey of the same group of people (but with less than 100% response rate) in red.

The margin of error (pale red ribbon) contains the actual score and surveyed score, even though they appear to be trending in different directions throughout the months. This is important because if you were taking action based on the trend of the red line it might not be have result you expect.
For your survey score to a smaller margin of error (and give you a sampled result closer to the true blue line) you could increase the % of people responding.
Remembering the data analysis best practice principles (so what…? and insight to action) if you were hoping that more than 90% of people are happy and over the months of this measurement only between 45% to 60% of people were happy, the absolute number doesn’t mean much – some action is needed.
How many responses do you need?
Imagine you wanted to know the percentage of pupils walking to school (in this case the answer is 50%). The graph below shows the response rate of surveys you need based on,
- asking every pupil (census)
- a survey where you are confident in the result within +/- 3 percentage points (e.g. 47%-53%)
- a survey where you are confident in the result within +/- 5 percentage points (e.g. 45%-55%)
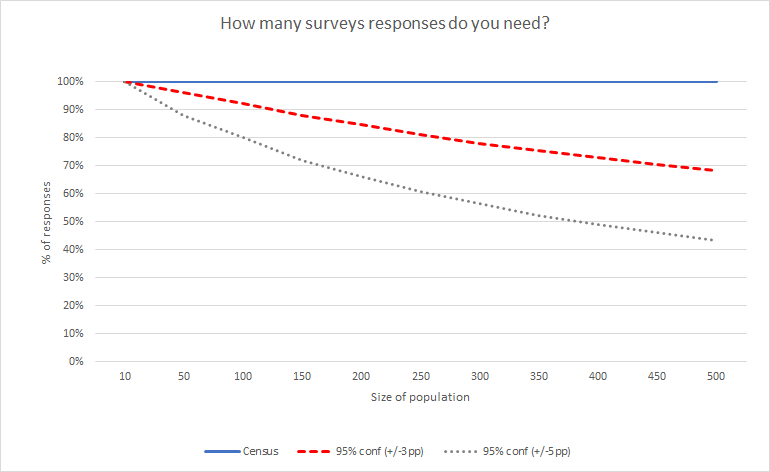
As you can see, the larger of the size of the population (e.g. number of pupils or staff) the lower the response rate needed. Also, as the precision of the result goes down the % of responses also goes down.
When setting up your survey and then analysing your results, making sure you are clear on how accurate you need the results to be can save you a lot of time and effort.
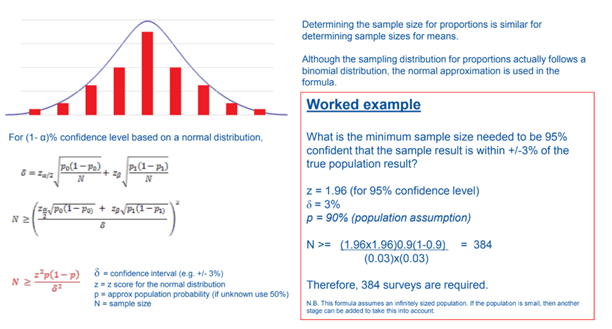
Now for the Maths
To calculate the number of responses you need or how accurate your score is from your survey you need to use the following formula,
Can I help?
I have a document that calculates the number of replies you need to your survey to be confident in the scores and a document that will provide you with the margin of error on a survey you have completed on my TES shop.
If you would like any support in setting up and/or analysing your schools surveys please get in touch.

Leave a comment